Policy Navigator: Empowering Brokers with Self-Service Tools
Redesigning Bradesco's Policy Query flow to reduce support dependency and improve client retention through proactive, self-service features.

Helping Brokers Take Control of Policy Management
The goal: To help brokers manage policies, find details faster, and work independently with fewer delays.
Helping Brokers Take Control of Policy Management
The goal: To help brokers manage policies, find details faster, and work independently with fewer delays.
Helping Brokers Take Control of Policy Management
The goal: To help brokers manage policies, find details faster, and work independently with fewer delays.
Simplified Self-Service Tools for Brokers
The redesigned platform centered around a streamlined dashboard with key features:
Simplified Self-Service Tools for Brokers
The redesigned platform centered around a streamlined dashboard with key features:
Simplified Self-Service Tools for Brokers
The redesigned platform centered around a streamlined dashboard with key features:
Active Policies Card
The new Active Policies Card shows the total active policies, newly issued policies, and recent cancellations, helping brokers track portfolio trends at a glance.
Active Policies Card
The new Active Policies Card shows the total active policies, newly issued policies, and recent cancellations, helping brokers track portfolio trends at a glance.
Active Policies Card
The new Active Policies Card shows the total active policies, newly issued policies, and recent cancellations, helping brokers track portfolio trends at a glance.
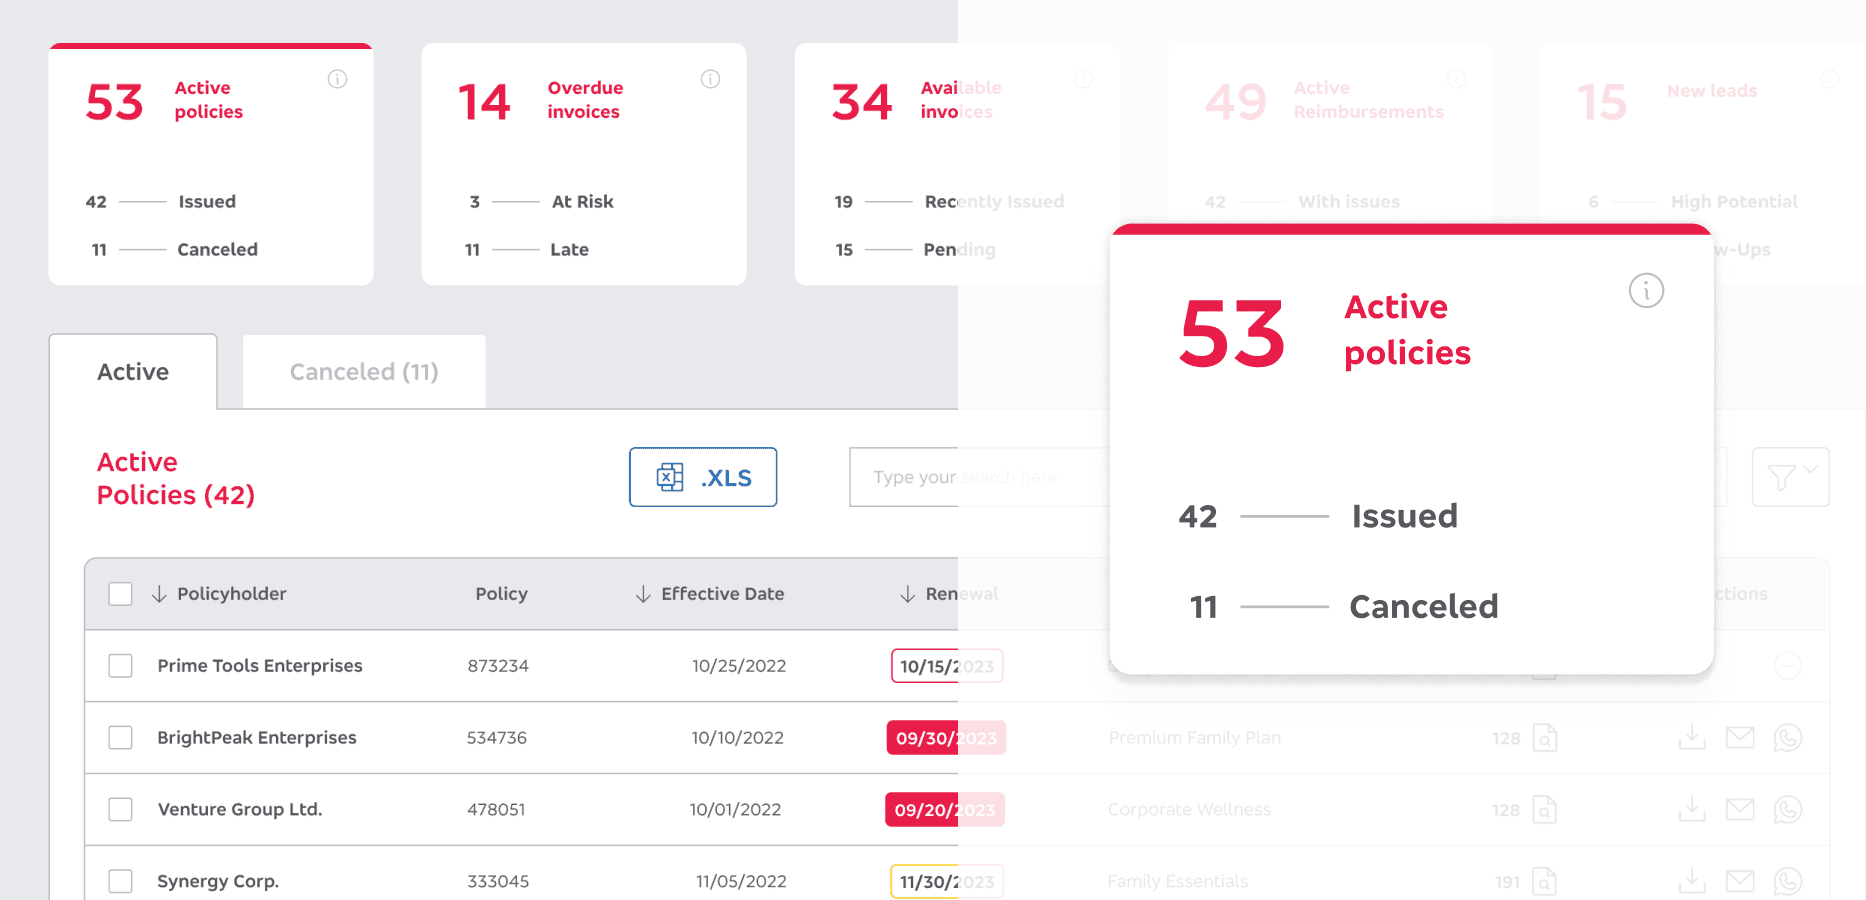
Track active policies, recent cancellations, and newly issued policies effortlessly with the Active Policies Card.
Renewal Alerts
Brokers get notified 45, 30, and 15 days before policy expiration, helping them follow up with clients and prevent churn.
Renewal Alerts
Brokers get notified 45, 30, and 15 days before policy expiration, helping them follow up with clients and prevent churn.
Renewal Alerts
Brokers get notified 45, 30, and 15 days before policy expiration, helping them follow up with clients and prevent churn.
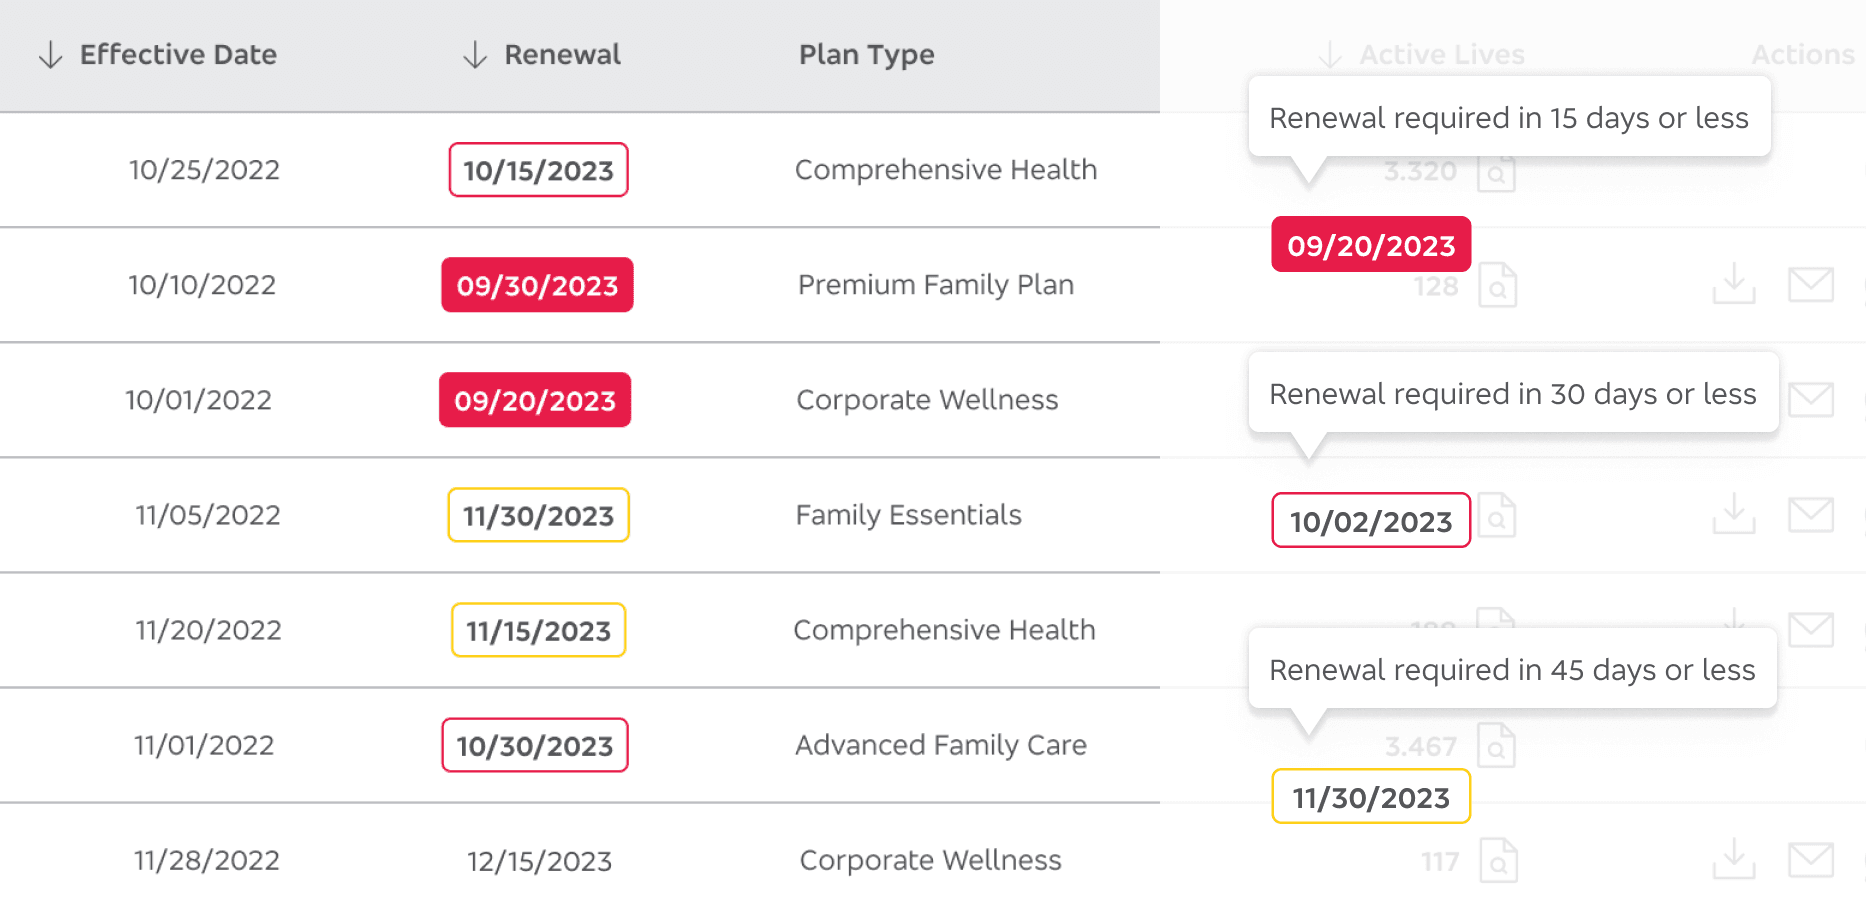
Alerts ensure proactive client outreach before policies expire.
Invoice Retrieval
A self-service tool to download and share invoices, reducing dependency on support teams.
Invoice Retrieval
A self-service tool to download and share invoices, reducing dependency on support teams.
Invoice Retrieval
A self-service tool to download and share invoices, reducing dependency on support teams.
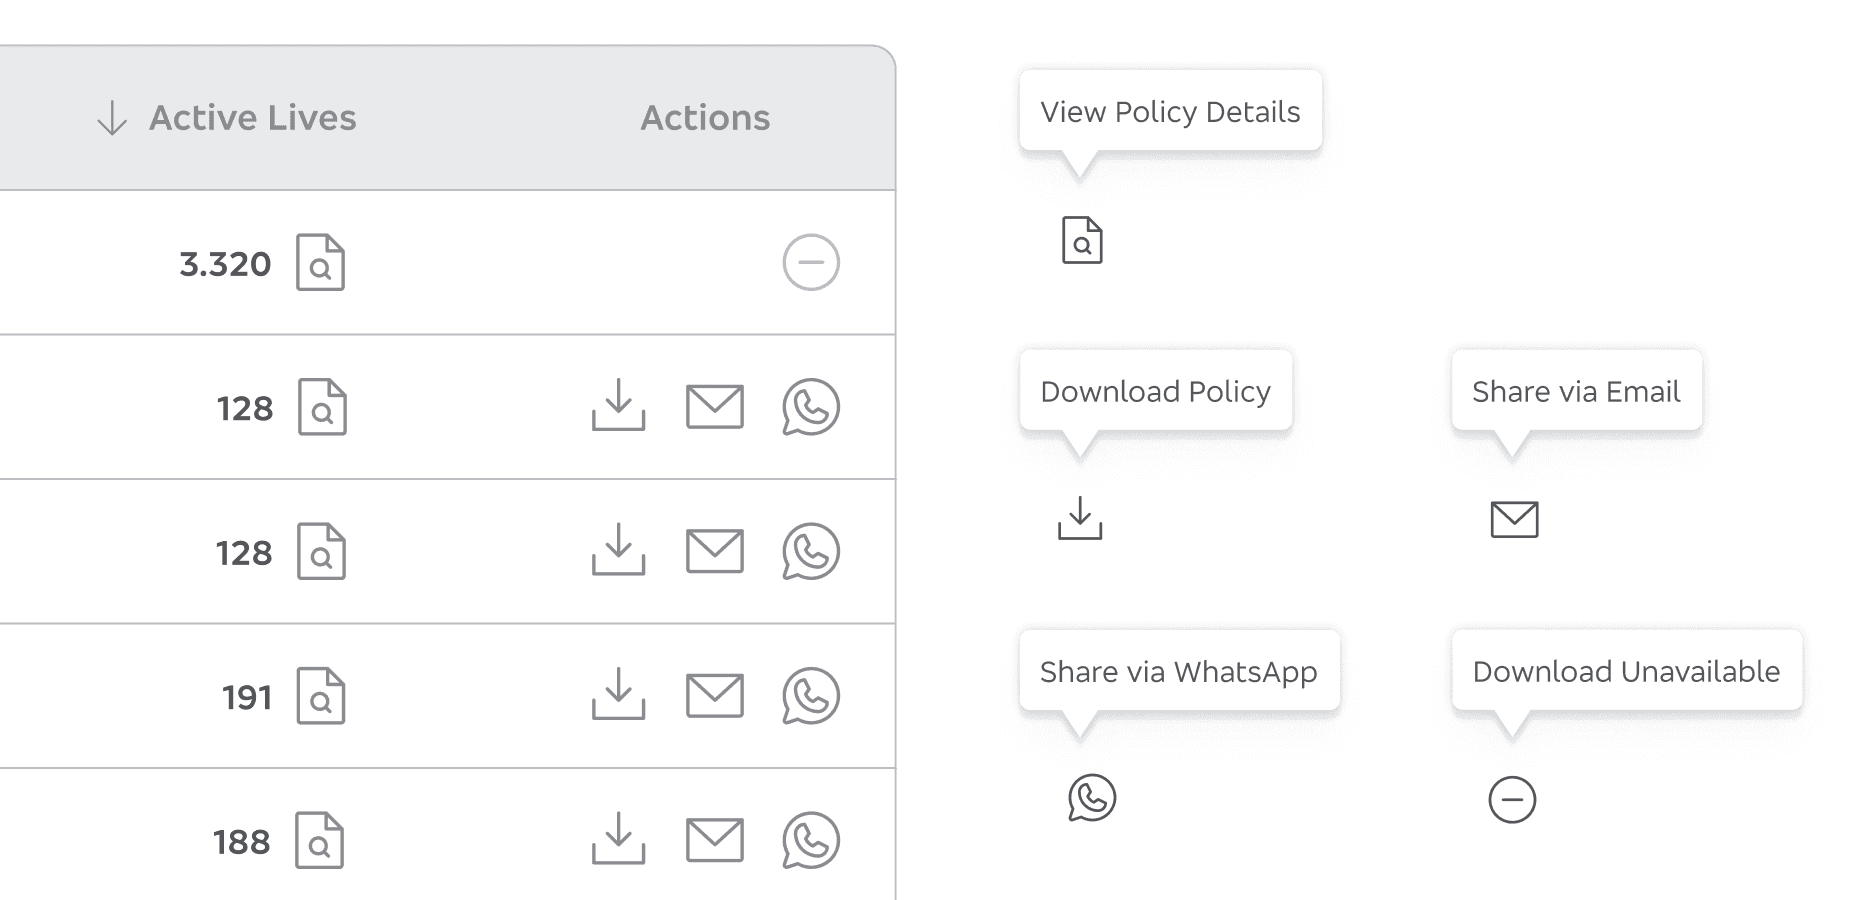
Invoice retrieval simplified for broker autonomy.
Unified Dashboard and Family Group View
The dashboard consolidates policy data for quick reference. From here, brokers can also access Family Group View, which displays individual members, dependents, and beneficiary details.
Unified Dashboard and Family Group View
The dashboard consolidates policy data for quick reference. From here, brokers can also access Family Group View, which displays individual members, dependents, and beneficiary details.
Unified Dashboard and Family Group View
The dashboard consolidates policy data for quick reference. From here, brokers can also access Family Group View, which displays individual members, dependents, and beneficiary details.
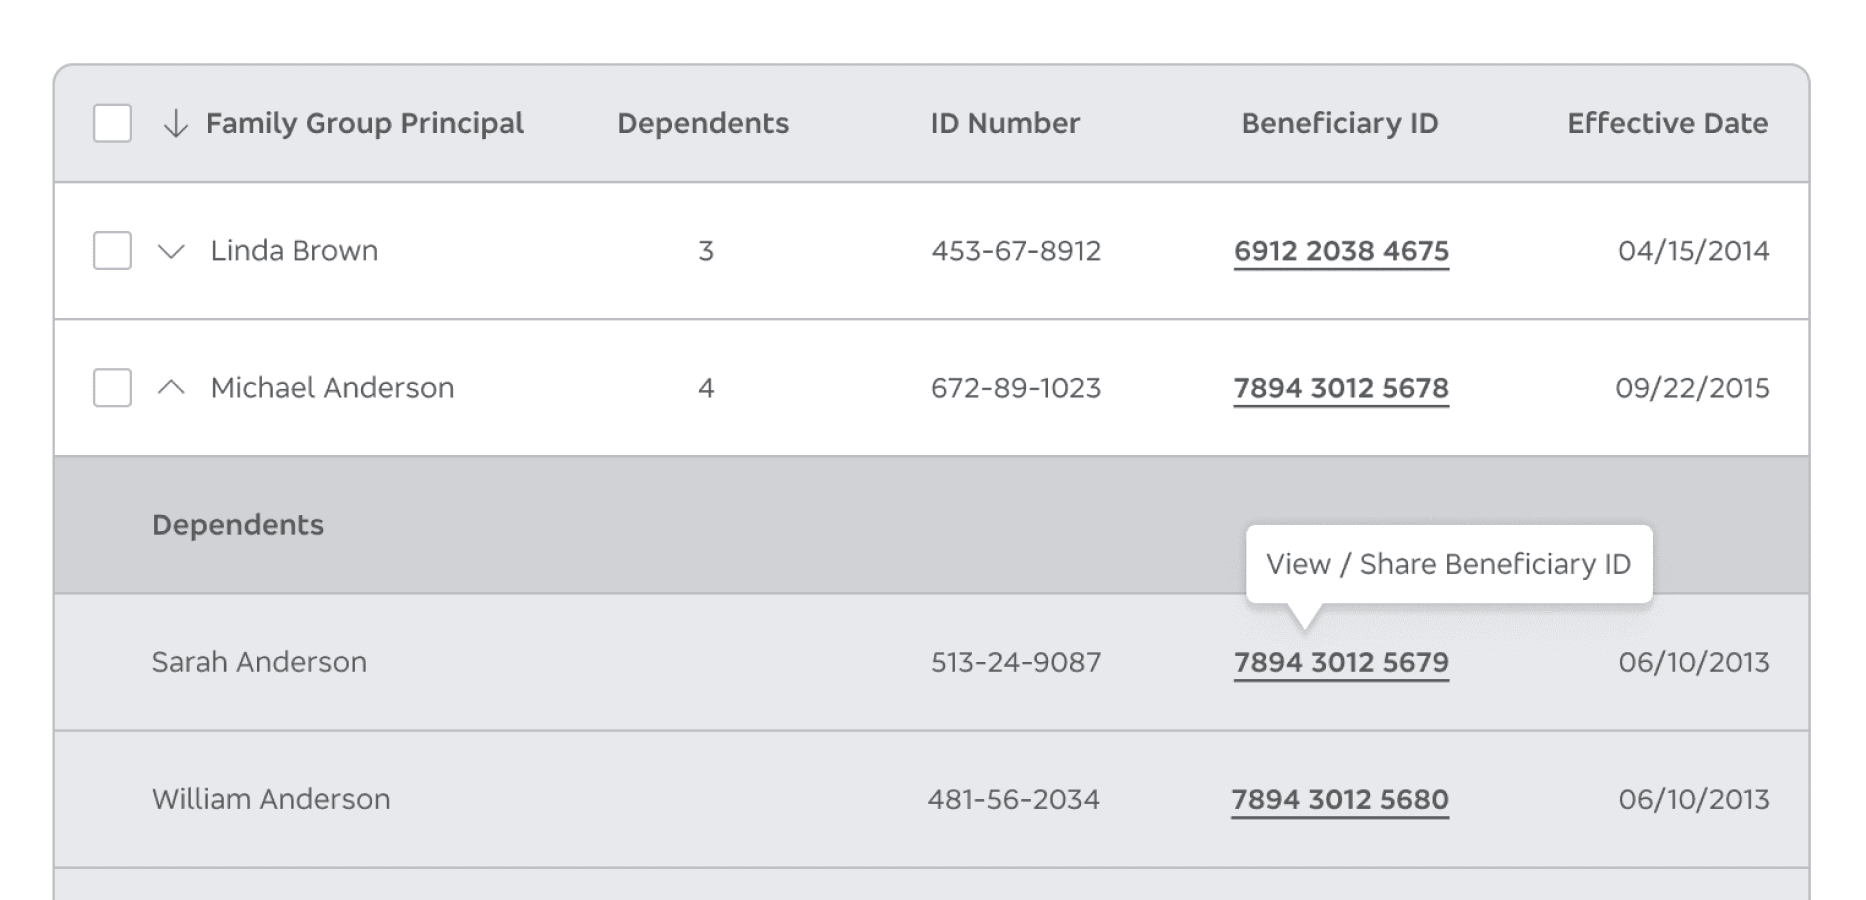
A unified dashboard with tools for managing policies and dependents.
Expected Impact: Faster Access and Fewer Support Requests
Brokers’ workload is expected to drop significantly, enabling them to spend more time on client retention and proactive engagement. Reduce ticket volume by up to 22% after adoption. Increase task completion rates by simplifying workflows.
Expected Impact: Faster Access and Fewer Support Requests
Brokers’ workload is expected to drop significantly, enabling them to spend more time on client retention and proactive engagement. Reduce ticket volume by up to 22% after adoption. Increase task completion rates by simplifying workflows.
Expected Impact: Faster Access and Fewer Support Requests
Brokers’ workload is expected to drop significantly, enabling them to spend more time on client retention and proactive engagement. Reduce ticket volume by up to 22% after adoption. Increase task completion rates by simplifying workflows.
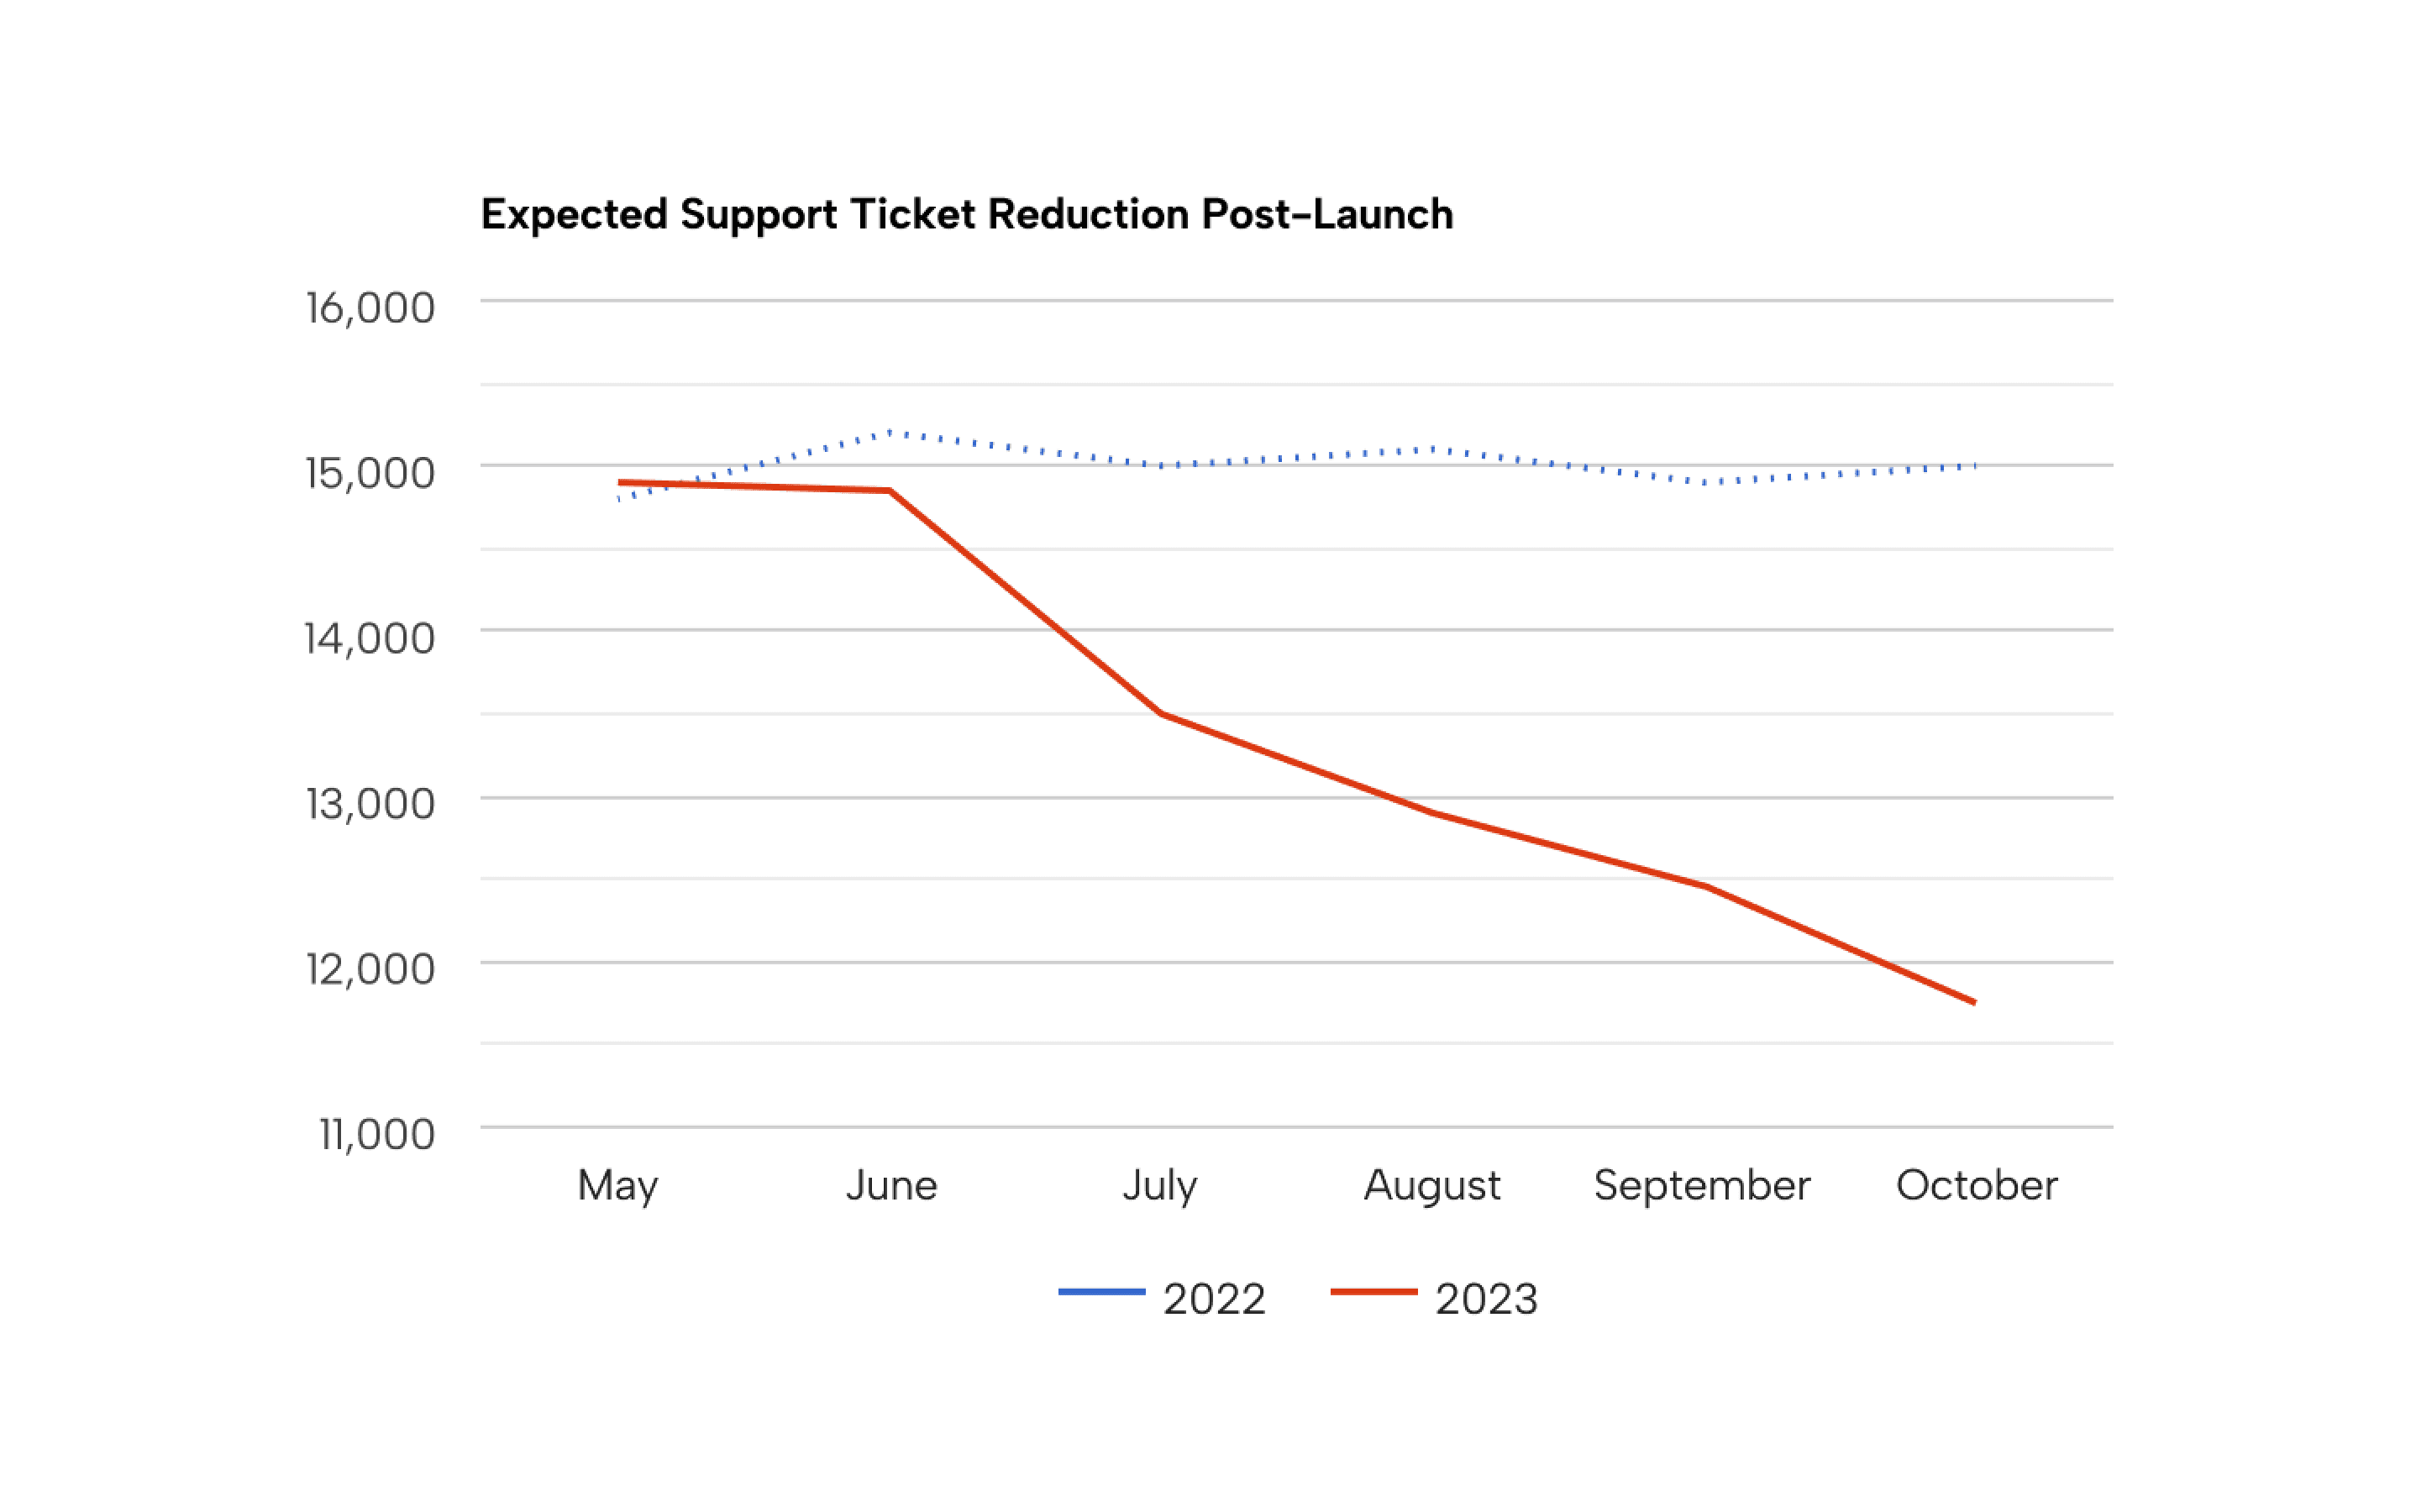
Projected reduction in support tickets highlights self-service adoption.
Simplified Self-Service Tools for Brokers
The redesigned platform centered around a streamlined dashboard with key features:
Simplified Self-Service Tools for Brokers
The redesigned platform centered around a streamlined dashboard with key features:
Simplified Self-Service Tools for Brokers
The redesigned platform centered around a streamlined dashboard with key features:
Interviews and Ticket Data
Interviews with brokers and analysis of ticket data revealed that policy queries accounted for over 60% of support tickets.
Interviews and Ticket Data
Interviews with brokers and analysis of ticket data revealed that policy queries accounted for over 60% of support tickets.
Interviews and Ticket Data
Interviews with brokers and analysis of ticket data revealed that policy queries accounted for over 60% of support tickets.

Policy queries dominated support requests, as reflected in data analysis and brokers’ insights.
High-Fidelity Prototypes
Prototypes simplified policy searches, renewal alerts, and invoice retrieval. They were designed to empower brokers with streamlined workflows.
High-Fidelity Prototypes
Prototypes simplified policy searches, renewal alerts, and invoice retrieval. They were designed to empower brokers with streamlined workflows.
High-Fidelity Prototypes
Prototypes simplified policy searches, renewal alerts, and invoice retrieval. They were designed to empower brokers with streamlined workflows.
Simplified prototypes addressing brokers’ workflow issues.
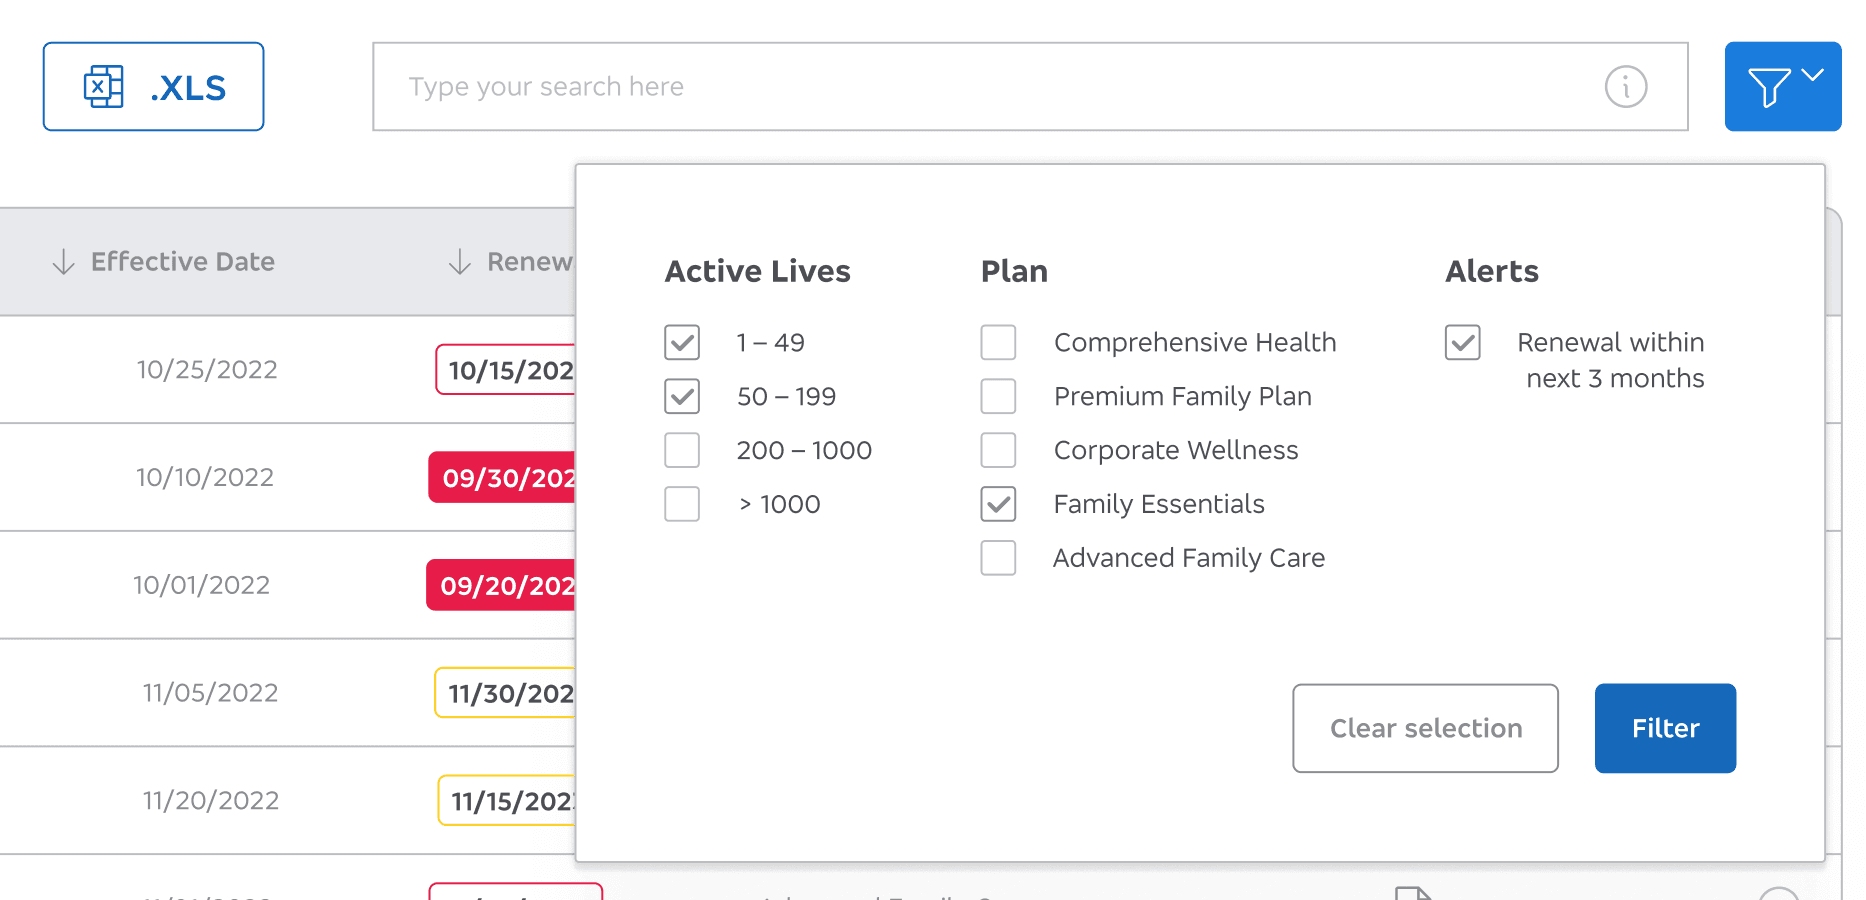
Usability Tests with Brokers
Testing with brokers revealed valuable feedback on filters and notifications. Search filters, inspired by broker input, were refined through iterations to enhance usability.
Usability Tests with Brokers
Testing with brokers revealed valuable feedback on filters and notifications. Search filters, inspired by broker input, were refined through iterations to enhance usability.
Usability Tests with Brokers
Testing with brokers revealed valuable feedback on filters and notifications. Search filters, inspired by broker input, were refined through iterations to enhance usability.

Usability testing informed clearer filters for brokers’ needs.
Based on User Feedback
The final iteration incorporated feedback on notification visibility, filters, and simplified navigation, leading to 100% task completion in follow-up tests.
Based on User Feedback
The final iteration incorporated feedback on notification visibility, filters, and simplified navigation, leading to 100% task completion in follow-up tests.
Based on User Feedback
The final iteration incorporated feedback on notification visibility, filters, and simplified navigation, leading to 100% task completion in follow-up tests.

Feedback-driven design improved usability and completion rates.
Key Research Insights
Understanding brokers' frustrations shaped the design.
Key Research Insights
Understanding brokers' frustrations shaped the design.
Key Research Insights
Understanding brokers' frustrations shaped the design.
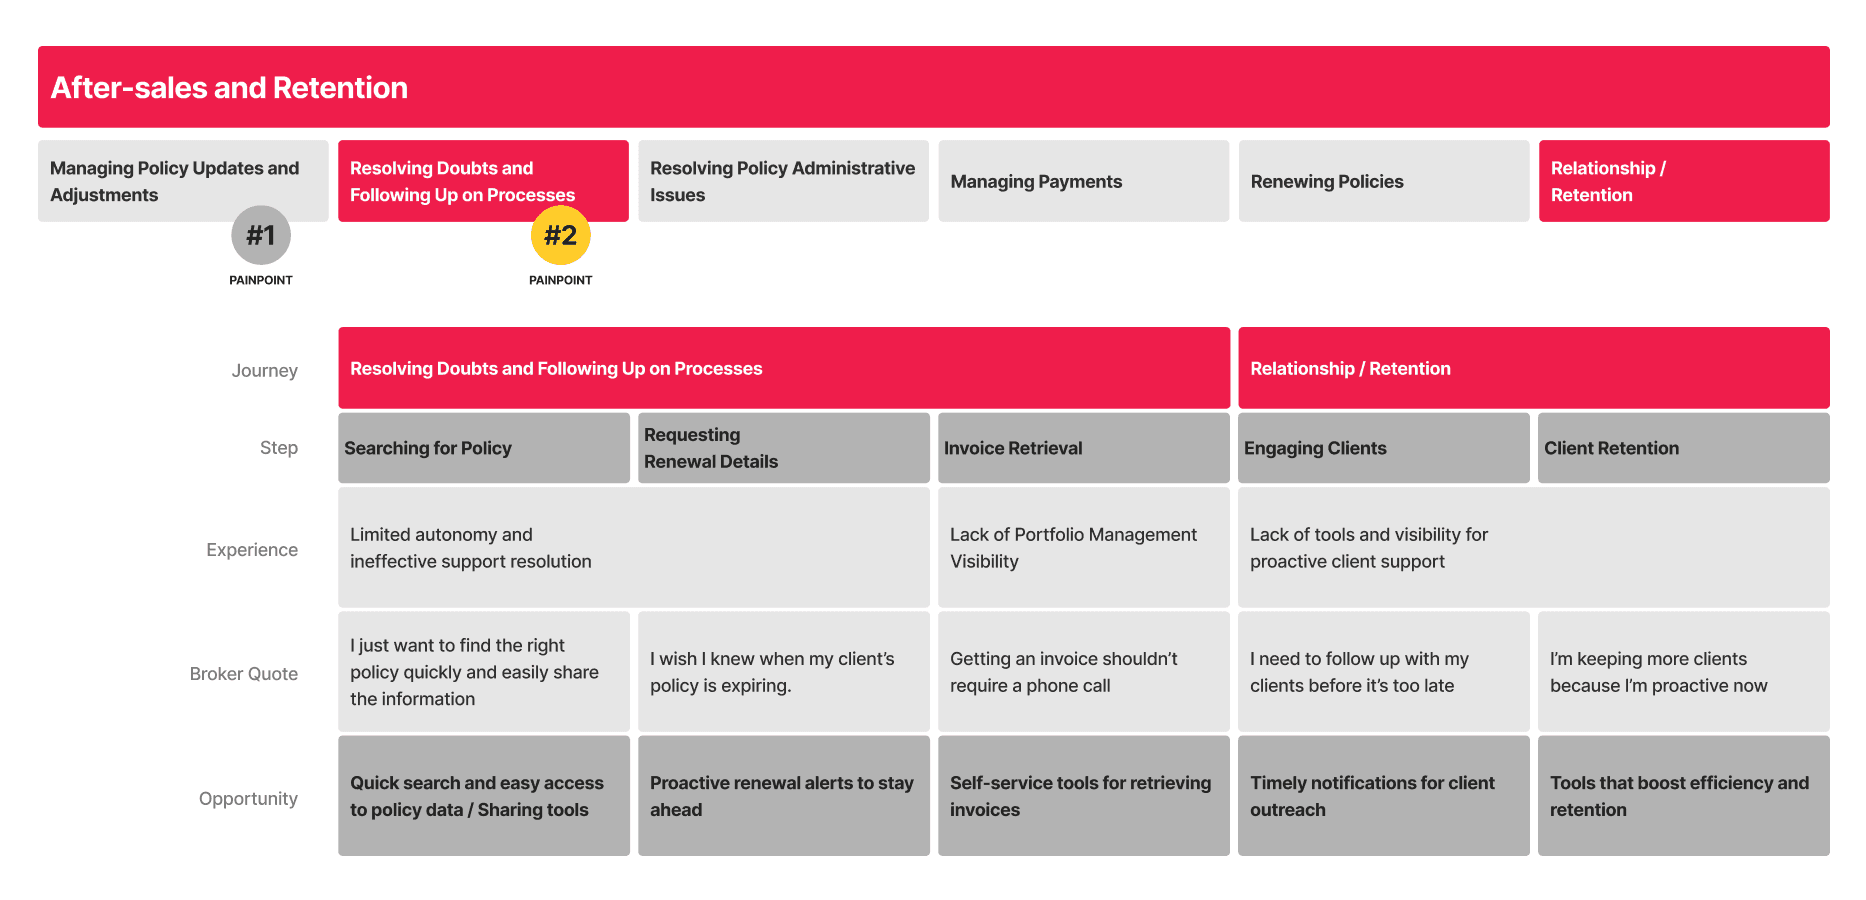
A broker’s journey toward autonomy and efficiency: From fragmented tools to seamless self-service.
Proactive Engagement
Brokers needed renewal alerts to reach clients before policies expired.
Proactive Engagement
Brokers needed renewal alerts to reach clients before policies expired.
Proactive Engagement
Brokers needed renewal alerts to reach clients before policies expired.
Self-Sufficiency
Simplifying invoice retrieval reduced dependency on support teams.
Self-Sufficiency
Simplifying invoice retrieval reduced dependency on support teams.
Self-Sufficiency
Simplifying invoice retrieval reduced dependency on support teams.
Workflow Efficiency
A unified dashboard for policy details streamlined daily tasks.
Workflow Efficiency
A unified dashboard for policy details streamlined daily tasks.
Workflow Efficiency
A unified dashboard for policy details streamlined daily tasks.
Measurable Impact on Broker Efficiency and Retention
Policy Navigator transformed how brokers manage policies by enhancing autonomy, streamlining workflows, and improving client engagement. These changes contribute to reduced churn, better client relationships, and stronger broker efficiency.
Measurable Impact on Broker Efficiency and Retention
Policy Navigator transformed how brokers manage policies by enhancing autonomy, streamlining workflows, and improving client engagement. These changes contribute to reduced churn, better client relationships, and stronger broker efficiency.
Measurable Impact on Broker Efficiency and Retention
Policy Navigator transformed how brokers manage policies by enhancing autonomy, streamlining workflows, and improving client engagement. These changes contribute to reduced churn, better client relationships, and stronger broker efficiency.
Key Takeaways and Strategic Improvements
Key Takeaways and Strategic Improvements
Key Takeaways and Strategic Improvements
Design Reflection
This project underscored the importance of designing for user autonomy and proactive engagement. Iterative testing and continuous feedback ensured that the final solution met brokers' needs while streamlining their workflows.
Design Reflection
This project underscored the importance of designing for user autonomy and proactive engagement. Iterative testing and continuous feedback ensured that the final solution met brokers' needs while streamlining their workflows.
Design Reflection
This project underscored the importance of designing for user autonomy and proactive engagement. Iterative testing and continuous feedback ensured that the final solution met brokers' needs while streamlining their workflows.
Process Optimization
By standardizing our approach to collecting and analyzing broker inputs, we created a scalable framework for future projects. This ensured consistency in user research and paved the way for more efficient data analysis, saving time and improving outcomes.
Process Optimization
By standardizing our approach to collecting and analyzing broker inputs, we created a scalable framework for future projects. This ensured consistency in user research and paved the way for more efficient data analysis, saving time and improving outcomes.
Process Optimization
By standardizing our approach to collecting and analyzing broker inputs, we created a scalable framework for future projects. This ensured consistency in user research and paved the way for more efficient data analysis, saving time and improving outcomes.
Next Steps
Explore additional self-service features to further streamline workflows and reduce support dependency.
Next Steps
Explore additional self-service features to further streamline workflows and reduce support dependency.
Next Steps
Explore additional self-service features to further streamline workflows and reduce support dependency.
Next Project

